Seed Germination AppVersion 1.0
Interactive data analysis platform for germination analysis
Germination Indexes
Dr. Mohammadreza Labbafi
Thanks to Dr. Omid Lotfifar for help in collecting the contents
of this text.
Table of Contents
1. Final germination percentage (FGP) or Germinability (G)
2. Mean germination Time (MGT)
3. Standard deviation of the germination time (SDG)
4. Variance of germination time (VGT)
5. Coefficient of variation of the germination time (CVT)
8. Germination rate index (GRI)
10. Synchrony of germination process (SYN)
11. Uncertainty of the germination process (UNC)
Germination Indexes
1. Final germination percentage (FGP) or Germinability (G)
According to Labouriau (1983), germinability is the percentage of seeds in which the germination process comes to the end in the experimental conditions by the intraseminal growth, resulting in the protrusion (or emergence) of a living embryo.
![]()
(in percentage; expressed in the program as FGP)
Where: ni: number of germinated seed in the ith time; N: total number of seed in each experimental unit.
The higher the FGP value, the greater the germination of a seed population (Scott et al., 1984).
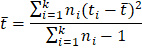
2. Mean germination Time (MGT)
The mean germination time was proposed by Haberlandt in 1875 (Labouriau, 1983) and used by Czabator (1962) as mean length of incubation time (see Ranal and Santana (2006) for other details). It is calculated as the weighted mean of the germination time (hour, day or other time unit). The number of germinated seeds at the intervals established for the data collection is used as weight (Ranal and Santana, 2006).
![]() ,
,
(in hour, day or other time unit; expressed in the program as MGT )
Where ti: time from the start of the experiment to the ith observation (day for the example); ni: number of seeds germinated in the ith time (not the accumulated number, but the number correspondent to the ith observation), and k: last time of germination.
MGT is an accurate measure of the time taken for a lot to germinate, but does not correlate this well with the time spread or uniformity of germination. It focusses instead on the day when most germination events occurred. The lower the MGT, the faster a population of seeds has germinated.
The lower the MGT, the faster a population of seeds has germinated (Orchard, 1977).
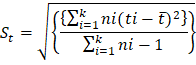
3. Standard deviation of the germination time (SDG)
(in the same time unit of the mean germination time; expressed in the program as SDG)
Where
![]() i
time from the start of the experiment to the
ith observation (hour, day or other time
unit); ni : number of
germinated seeds in the
ith time (not the accumulated number)
and k: the last time of observation.
i
time from the start of the experiment to the
ith observation (hour, day or other time
unit); ni : number of
germinated seeds in the
ith time (not the accumulated number)
and k: the last time of observation.
4. Variance of germination time (VGT)
(in the same time; expressed in the program as VGT)
Where
![]() :
mean germination time; ti: time between the start of the
experiment and the ith observation (day for the example);
ni: number of seeds germinated in
the ith time, and k: last time
of germination.
:
mean germination time; ti: time between the start of the
experiment and the ith observation (day for the example);
ni: number of seeds germinated in
the ith time, and k: last time
of germination.
5. Coefficient of variation of the germination time (CVT)
![]()
(in the same time unit of the mean germination time; expressed in the program as CVT)
Where st: standard deviation of the germination time and t: mean germination time.
6.Mean germination rate (MGR)
The
mean germination rate is defined as the reciprocal of the mean germination
time, since the mean germination rate increases and decreases with![]() ,
not with
,
not with ![]() (Labouriau,
1983b).
(Labouriau,
1983b).
![]()
(in hours-1, day-1 or other reciprocal time unit, expressed in the program as MGR)
7. Germination speed (GSP)
![]()
(in percentage, expressed in the program as MGR)
8. Germination rate index (GRI)
GRI =G1/1+G2/2+....+Gi/i
(in percentage/day, expressed in the program as GRI)
Where G1 is the germination percentage on day 1, G2 is the germination parentage at day 2; and so on.
GRI calculations merely show the percentage of germination per day, so the higher the percentage and the shorter the duration, the higher the GRI. This parameter lacks any correlation with the high and low germination days as it spreads the percentage evenly across the time spread (Ranal et al., 2009).
The GRI reflects the percentage of germination on each day of the germination period. Higher GRI values indicate higher and faster germination (Esechi, 1994) after modification.
9. Germination Index (GI)
GI= (10*n1) + (9*n2) +...+ (1*n10)
(expressed in the program as GI)
Where n1, n2 . . . n10 = No. of germinated seeds on the first, second and subsequent days until the 10th day; 10, 9 . . . and 1 are weights given to the number of germinated seeds on the first, second and subsequent days, respectively.
The GI appears to be the most comprehensive measurement parameter combining both germination percentage and speed (spread, duration and high/low events). It magnifies the variation among seed lots in this regard with an easily compared numerical measurement (Ranal et al., 2009).
In the GI, maximum weight is given to the seeds germinated on the first day and less to those germinated later on. The lowest weight would be for seeds germinated on the 10th day. Therefore, the GI emphasizes on both the percentage of germination and its speed. A higher GI value denotes a higher percentage and rate of germination (Bench Arnold et al., 1991)
10. Synchrony of germination process (SYN)
This index was proposed by Primack (1985) to assess the degree of overlapping of flowering among individuals in a population and Ranal and Santana (2006) adopted it for seed germination. The synchrony of germination of one seed with another assumed Z=1 when the germination of all seeds occur at the same time and Z=0 when at least two seeds can germinate, one at each time.

(a dimensional measurement; expressed in the program as SYN);
being
![]() ;
;
![]()
Where
![]() :
combination of the seeds germinated in the ith time, two by
two, and ni: number of seeds germinated in the
ith time.
:
combination of the seeds germinated in the ith time, two by
two, and ni: number of seeds germinated in the
ith time.
11. Uncertainty of the germination process (UNC)
This measurement is an adaptation of the Shannon index and measures the degree of uncertainty associated to the distribution of the relative frequency of germination (Labouriau and Valadares, 1976). Low values indicate more synchronized germination (Ranal and Santana, 2006).
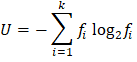
(in
bit; expressed in the program as UNC);
being ![]()
Where fi: relative frequency of germination; ni: number of seeds germinated on the ith time, and k: last day of observation.
Reference List
Bench A.R., Fenner, M. and Edwards, P. 1991. Changes in germinability, ABA content and ABA embryonic sensitivity in developing seeds of Sorghum bicolor (L.) Moench induced by water stress during grain filling. New Phytologist. 118: 339-347.
Czabator, Felix J. 1962. Germination value: an index combining speed and completeness of pine seed germination. Forest Science. 8 (4): 386-96.
Esechie, H. 1994. Interaction of salinity and temperature on the germination of sorghum. Journal of Agronomy and Crop Science. 172: 194-199.
Labouriau, L.G. 1983. A germinaco das sementes. Washington.
Labouriau, L.G. 1983b. Uma Nova Linha de Pesquisa Na Fisiologia Da Germinacao Das Sementes. In Anais do XXXIV Congresso Nacional de Botanica.
Labouriau, L.G., and M.B. Valadares. 1976. On the Physiology of Seed of Calotropis Procera. Anais Da Academia Brasileira de Cincia. Rio de Janeiro. 42 (2): 235-264.
Orchard, T. 1977. Estimating the parameters of plant seedling emergence. Seed Science and Technology. 5: 61-69.
Primack, Richard B. 1985. Patterns of Flowering Phenology in Communities, Populations, Individuals, and Single Flowers. In The Population Structure of Vegetation. 571-93. Springer.
Ranal, M.A., Santana, D.G., Ferreira, W.R. and Mendes-Rodrigues, C. 2009. Calculating germination measurements and organizing spreadsheets. Braz J. Bot. 32: 849-55.
Ranal, Marli A., and Denise Garcia de Santana. 2006. How and why to measure the germination process? Revista Brasileira de Botanica. 29(1). Sociedade Botanica de São Paulo: 1-11.
Scott, S., Jones, R. and Williams, W. 1984. Review of data analysis methods for seed germination. Crop Science. 24: 1192-1199.